
When i tried to plot the data with Google Visualization API, the data point is not in chronological order.
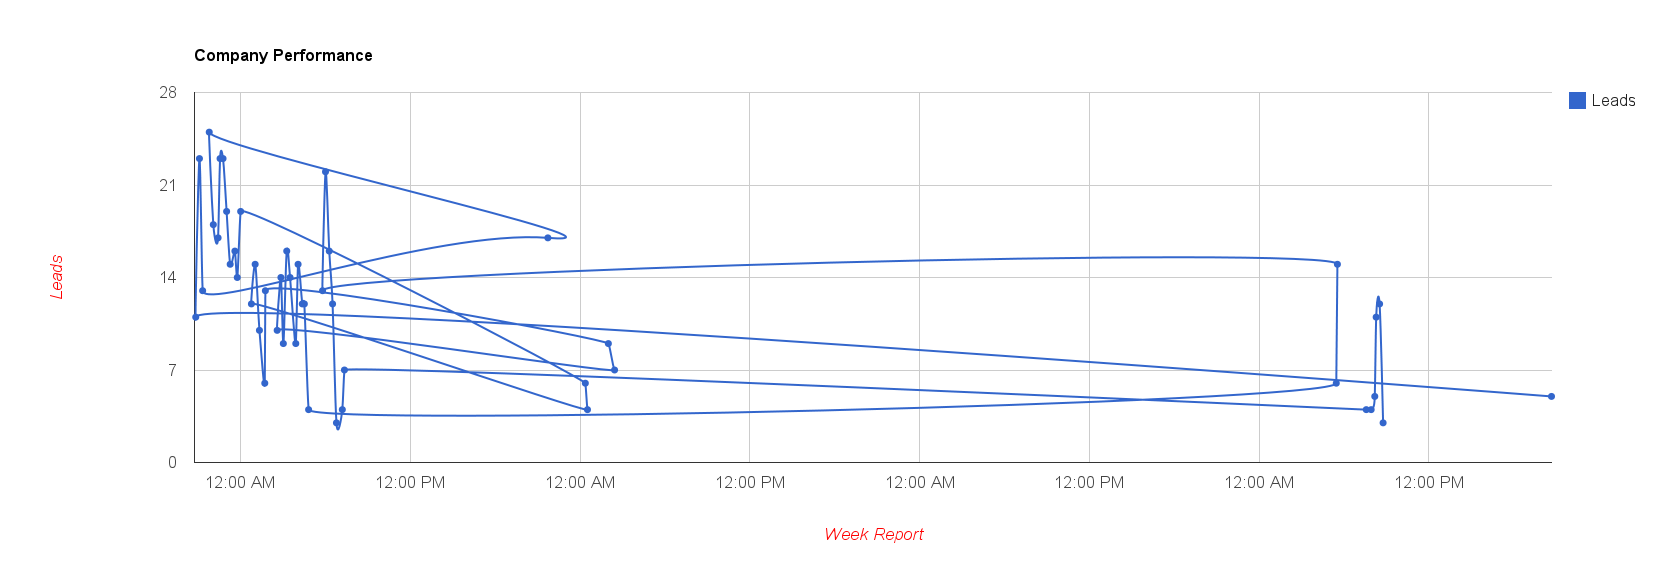
There are 2 ways to solve the problem
1. Sort the data before adding the the DataTable.
***Or***
2. Sort by DataTable.sort() after adding to DataTable.
var chartData = new google.visualization.DataTable();
chartData.addColumn('datetime', 'Datetime');
chartData.addColumn('number', 'Total Requests');
// Other data points ...

// Prepare the data row ...

// Sort the data by the first column
chartData.sort(0);
It also works if the x-axis is a timestamp in string.
var chartData = new google.visualization.DataTable();
chartData.addColumn('string', 'Datetime');
chartData.addColumn('number', 'Total Requests');
// Other data points ...

// Prepare the data row ...

// Sort the data by the first column
chartData.sort(0);
Done =)
Reference:
- Google Visualization Line Chart with fixed interval
- Google Visualization API
- Google Visualization API – DataTable#sort

