
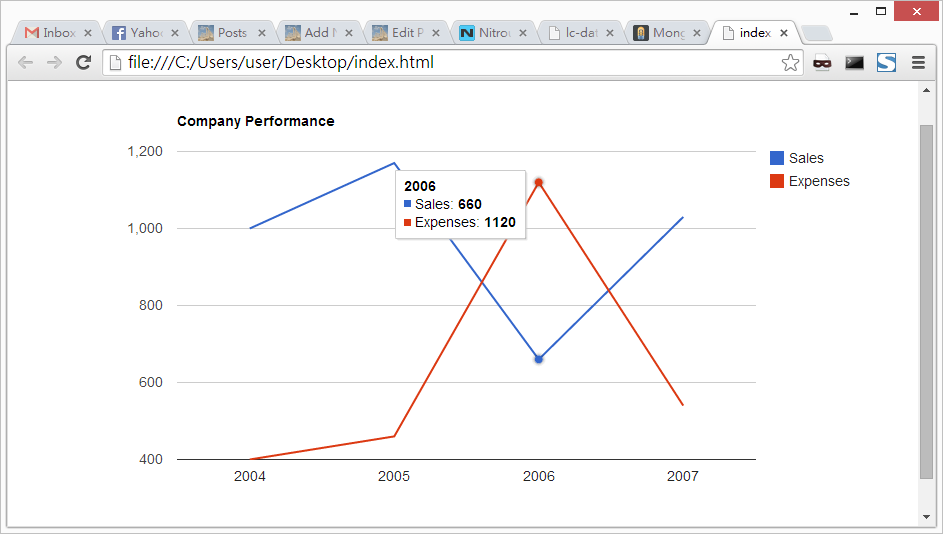
Instead of showing the data of the mouse hovering line in the tooltip, i would like to show all lines data of the same x-axis value. This can be easily done by adding the focusTarget in the chart options object.
<!DOCTYPE html>
<html>
  <head>
    <script type="text/javascript" src="https://www.google.com/jsapi"></script>
    <script type="text/javascript">
      google.load("visualization", "1", {packages:["corechart"]});
      google.setOnLoadCallback(drawChart);
      function drawChart() {
        var rawData = [
          ['Year', 'Sales', 'Expenses'],
          ['2004',  1000,      400],
          ['2005',  1170,      460],
          ['2006',  660,       1120],
          ['2007',  1030,      540]
        ];
        var data = google.visualization.arrayToDataTable(rawData);

        var options = {
          title: 'Company Performance',
          focusTarget: 'category' // Group the lines in tooltip
        };

        var chart = new google.visualization.LineChart(document.getElementById('chart_div'));

        chart.draw(data, options);
      }
    </script>
  </head>
  <body>
    <div id="chart_div" style="width: 900px; height: 500px;"></div>
  </body>
</html>
Here is the result.
Done =)
Reference:

