
Using graph is a very good way to present numeric data. Here is a jQuery plugin called jqBarGraph which help you creating bar charts in a painless way.
1. Download the jqBarGraph in the js folder under webroot.
2. Create the following index.html.
<!DOCTYPE html>
<html>
<head>
<title>jqbargraph</title>
<script src="//ajax.googleapis.com/ajax/libs/jquery/2.0.0/jquery.min.js"></script>
<script type="text/javascript" src="js/jqBarGraph.1.1.min.js"></script>
<script type="text/javascript">
$(document).ready(function(){
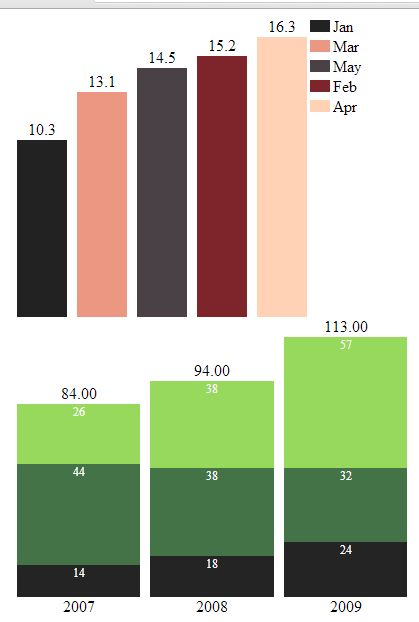
// Simple bar chart
arrayOfData = new Array(
[10.3,'Jan','#222222'],
[15.2,'Feb','#7D252B'],
[13.1,'Mar','#EB9781'],
[16.3,'Apr','#FFD2B5'],
[14.5,'May','#4A4147']
);
$('#simple-bar-chart').jqBarGraph({
data: arrayOfData, // Initialize the data
sort: 'asc', // Sorting
legend: true // Show legend
});
// Multi bar chart
arrayOfDataMulti = new Array(
[[14,44,26],'2007'],
[[18,38,38],'2008'],
[[24,32,57],'2009']
);
$('#multi-bar-chart').jqBarGraph({
data: arrayOfDataMulti,
colors: ['#242424','#437346','#97D95C']
});
});
</script>
</head>
<body>
<div id="simple-bar-chart"></div>
<div id="multi-bar-chart"></div>
</body>
</html>
Check it out.
Visit the jqBarGraph homepage and find out more features.
Done =)
Reference: jqBarGraph- graph your data easily


One thought on “jqBarGraph – jQuery Bar Chart Plugin”